Hi Folks,
The big question is will the FED raise rates next week. Virtually everyone on Wall Street believes that they will raise. I guess I am the lone wolf who believes that they will NOT raise rates.
Although Janet Yellen recently changed her talk from "the fed may raise rates" to "if we raise rates, the next one will not come for a while", I still believe the answer is no. I wish and hope that they do raise rates because that is exactly what is needed. The fact is the FED does not want to look foolish by raising rates and then shortly there after having to cut them back again and possibly start QE4.
If you look at the economic data, the economy is slowing. Manufacturing numbers are at 6 year lows, employment numbers are weak, and the giant retailers like Walmart are getting crushed. The headline 5.1% unemployment rate does not show the real situation. The labor force participation rate is at 40 year lows and we are losing higher paying jobs. The jobs that have been added in the past few years are mainly lower income jobs.
There are plenty of bubbles that will be popping with higher rates. The auto industry is a giant bubble, the housing market is in a bubble, and the credit markets are in a major bubble.
I am still very bearish for the longer term(next 1-3 years) and I believe, as in my last post, that from here we make lower highs and lower lows going forward. My long term target in SPY(SP500 ETF) is 89, currently trading roughly 206.
Thanks and Good Trading,
Tim
Friday, December 11, 2015
Friday, November 13, 2015
Where is the Market Heading?
Hi Folks,
So here we are again. This is the second chance I have been referring to in my prior posts. Please take the steps the protect your portfolio now. You will not get another chance. As I mentioned in my earlier posts, the market has rebounded back into the moving averages and now we beginning the longer term move down. I have received feedback that maybe I have not been clear about how this would unfold so I will attempt again.
The initial phase of a reversal is a big move down, roughly 5 - 40%, then a move back into the moving averages (2nd chance), then begins the series of lower lows and lower highs until the it eventually bottoms out. We started this reversal with a 14% move lower off of the highs. Right now we are in the 2nd chance stage. We have rebounded back into the moving averages, From this point I expect lower lows and lower highs.
At today's close SPY was at $204.84. My target over the next few years for the bottom is $88 in SPY. Keep in mind, I've used the same modeling to calculate the low is 2003, the high in 2007, the low in 2009, and the high in 2015. These numbers are almost exact in every case. In an earlier post I showed you the Fibonacci chart showing the high for 2015. Here are the charts for the 2015 top and the eventual bottom over the next few years,


Thanks and Good Trading,
Tim
Monday, October 12, 2015
2nd Chance
Hi Folks,
On my August 21st post I said that if you did not sell or hedge your positions, not to worry you would get a 2nd chance. We are in the midst of that 2nd chance in my opinion. In the short term we could go back up near the highs. I urge you to use this opportunity to sell or hedge your positions.
I also mentioned that I believe that we are already in a recession. The technical definition of a recession is 2 consecutive quarters of negative GDP growth. The real economy shows signs prior to the GDP releases. The last 2 jobs reports have been awful and then revised even lower the following month. The jobs numbers show a labor force participation rate of 62.4% which is the lowest in nearly 40 years. This number is more important than the unemployment rate. It shows that an alarming number of people are dropping out of the work force because of extended unemployment and no ability to find a higher paying job so they are forced to not work or to work part time.
The Q3 GDP number will be released on October 29th. The street is expecting 2.5%. It will be interesting to see what the number comes in at. My guess is far below 2.5%. Could this be the 1st negative GDP quarter to start the official recession? It's possible but I doubt it. My guess is much lower than expected and then possibly Q4 being negative followed by Q1 2016 as a negative as well.
Thanks and Good Trading,
Tim
Friday, October 2, 2015
Deja Vu All Over again Carl Icahn
Hi Folks,
I am glad to see at least one mainstream business tycoon coming on board with the things that I have been talking about. Here is a video from Carl Icahn from September 29th 2015.
Thanks and Good Trading,
Tim
I am glad to see at least one mainstream business tycoon coming on board with the things that I have been talking about. Here is a video from Carl Icahn from September 29th 2015.
Thanks and Good Trading,
Tim
Monday, September 21, 2015
Next Leg Down in Market
Hi Folks,
Well as I expected the Fed did not raise rates. The market originally rallied then sold off. We are in the continuation of the sell off. We are in the next leg down. Roughly another 10% lower from here. I feel the SPY target in the next 2 weeks is $170. Currently trading $196. That would represent roughly 20% off the highs and put us in an official bear market.
Thanks and Good Trading,
Tim
Tuesday, September 15, 2015
Will The Fed Raise Rates Tomorrow?
Hi Folks,
For a guy who claims to stick to technical analysis I sure am writing too often about economic fundamentals more and more. With that being said here we go again.
The Fed really can't raise rates tomorrow. If they do it will start a rush to the exits in US Treasuries further pushing rates higher and higher without the Fed ever having to raise rates again for a long time and in a short period of time causing a reversal of policy triggering QE4.
China, the largest holder of US Treasuries, has recently started dumping treasuries. Why? At the beginning of this month China announced that is was committed to letting the Yuan or Renminbi actually float against other currencies. This is HUGE folks! In my opinion this is part of their openness about wanting a currency other than the US Dollar as the world's reserve currency. China has for a long time had it's currency literally pegged to the US Dollar until 2005 but then purchased such a huge portion of US Treasuries that it was still unofficially pegged to the dollar. Now that it wants to float it has to sell it's treasuries.
Additionally due to falling commodity prices and political unrest, the Emerging Market economies currencies are in free fall potentially forcing them to liquidate their US Treasuries. They account for about 6 trillion of the outstanding US Treasuries. So if they liquidate only 10% of their treasuries that amounts to an increase in the 10 yr of about 108bps or 1.08% alone. For every 1% rise in rates it costs the government $170 billion more in interest. Where will this come from?
I think the writing is on the wall. We are heading down the rough road of economic contraction coupled with inflation regardless of what the Fed does tomorrow. Ouch!!
Thanks and Good Trading,
Tim
Sunday, September 13, 2015
Is The Dollar Is About to Plunge
Hi Folks,
The US Dollar is looking like the stock market....about to plunge. So what does that mean to you and me? Well for a lot of US companies it would seem to be a good thing. If the dollar falls the cost for other countries to buy our goods and services goes down. That leads to an increase in our exports. On the flip side, it means that it will cost you and I more to buy goods because the U.S. is a net importer.
The bigger problem is what I see longer term. As in my earlier post regarding the global debt crisis, the US debt could lead to a collapse of the US dollar. I will preface this with saying that I feel this scenario is the most unlikely to unfold however, it is a possibility.
What would happen if the dollar collapses? This scenario is not pleasant at all. Most of the world trade today is done in US dollars. Most foreign nations hold a lot of US dollars in reserve due to this fact. What if those countries suddenly lost confidence in the US solvency? They would dump dollars leading to a snowball effect of selling dollars.
This would lead to at first more deflation like we have experienced thus far but then it would lead to hyperinflation and the destruction of people's savings. What that means is that if you have $1,000,000 dollars saved, the buying power is diminished significantly. You would still have $1,000,000 but what you could buy with that million dollars goes down significantly. So a gallon of milk that today is roughly $3.50 would suddenly be $100 or $1000 dollars. Sounds crazy right? But it has happened many times in history in the case of a total currency collapse.
I do not watch the news or read the newspapers. Any opinions I form are based entirely on my own research. If I want economic data I go to The Federal Reserve or the US Treasury websites and look at the data for myself. Here are 2 charts from the St. Louis Federal Reserve website. As you can see, the money supply has gone parabolic while the velocity of money is plunging. What does this mean in layman terms? The unprecedented QE has exploded the supply of money. The idea was to pump money into the economy and stimulate economic activity. So how do you measure it's effectiveness? The best way is to look at the velocity of money to measure economic activity. If I buy a sandwich and I leave a $1 tip, then the waiter takes a cab home and uses that $1 to pay for the cab and then the cab driver uses that $1 to pay for gas, that would have a velocity of 3. If instead the waiter took my $1 and put it in a jar and didn't invest it it would have would have a velocity of 1. Velocity measures the speed that $1 moves through the economy or how many times it moves through the economy. As you can see on the chart, the velocity of money is plunging while the money supply is exploding. In other words, QE did not work and the real economy is about to become known. We are already in a recession. QE ended in October 2014. QE was artificially holding up our economy. Now the massive money supply is out there with no economic growth.


I am not a doom and gloomer. I was quite bearish from 2007 to early 2009 but then I became extremely bullish in March of 2009. I have remained a cautious bull until the beginning of this year, 2015. I am a trader so all of my market directional opinions are based on technical analysis. As you know I am very bearish and feel that 2016 is not going to be a good year for the stock market.
Thanks and Good Trading,
Tim
Saturday, September 12, 2015
Short Term Market Outlook
Hi Folks,
I thought I'd share my short term trading thoughts. A few weeks ago I told you that I believed that SPY would trade down to 190 within 2 weeks which would represent a 10% drop and that is what happened. I am not revisiting to brag but to point out that the technical analysis that I do works.
Normally based upon my technical analysis used for day trading I would be actually short term bullish on the market(please don't confuse this with me turning bullish). Meaning the next few days would be bullish. My long term position is the same. The market is going down longer term. That being said, even though my short term signals say buy, the longer term look really bad. Putting literally the next few days as a potential for something bad to happen in the world. Before you think I'm nuts let me explain. My call for SPY to hit 190 was a given in my opinion. My concern over terrorism or something else in the next few days is not a given. My reason for this is because even though the market was down 14% off the highs at it's low a few weeks ago, the market should have gone lower from a technical standpoint. If it's going to go lower according to the technical analysis I do, it requires some sort of unforeseen event to turn this down again in the short term. Otherwise, the market will bounce in the next few days.
Thanks and Good Trading,
Tim
Saturday, August 22, 2015
Global Debt Crisis
Hi Folks,
I normally stick to technical analysis because that is what I know best. However, with my recent posts regarding the impending massive selloff, I figured I would impose my fundamental "opinion" here as well.
In some of my posts I questioned what the catalyst for the selloff would be? Terrorism, interest rates, student loan crisis etc. However any of these are just a guess to what tips the market on it's side. The root problem is the same as it was in 2007 only now much...much bigger.
Debt is what caused the massive selloff from 2007 to 2009. One would think that after that crisis, globally we would have learned a thing or two and made some changes. The sad fact is that in the last 7 years, global debt has increased by an incredible and unsustainable 40%. Our own federal reserve has increased the debt on it's balance sheet 800% since the market bottom in 2009. These levels are clearly unsustainable and ultimately this nation and other nations will have to make some hard choices to get back on track.
Couple the massive debt collapse with the shift from the "open outcry" trading model to a world where almost every market is 99% electronic trading and you set the stage for an 80% market correction.
This is what will be talked about in the media after the dust settles and the crisis is near it's end. Why isn't this a major focus for the media right now? Hopefully you are all taking steps to protect yourself from what is about to unfold.
Thanks and Good Trading,
Tim
Friday, August 21, 2015
Market Crash Redux
Hi Folks,
Well it looks like the beginning stages of the selloff that I have been talking about is here. I think SPY will drop to 190 within the next 2 weeks. If that level doesn't hold the next level is 175. 190 would be a 10% drop off the highs but in my opinion just the beginning of the bigger selloff. Again, I have many scenarios that may unfold. The best case is a 30% selloff and the worst case is an 80% selloff. Any way you slice it, it's not good. Hopefully you took my advice and talked to your financial advisor about collaring off your positions. The market doesn't normally just go straight down so if you have not taken action you will get a chance to do so. The bottom will probably take 2 years to unfold.
Thanks and Good Trading,
Tim
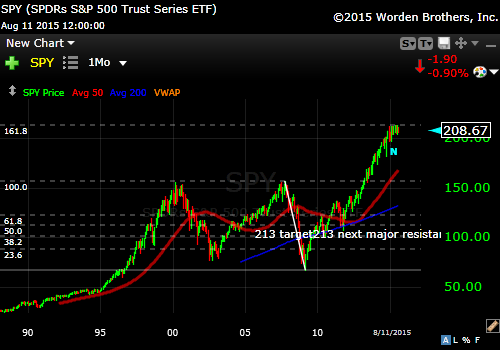
Tuesday, August 11, 2015
Market Crash Imminent?
Hi Folks,
Just another update. I am still bearish on the market. I believe the selloff begins before the end of the year. Chart wise, the end of September looks particularly bad. It looks as though something bad is going to happen. Maybe terrorism? I really think people need to protect their portfolios going into the next few years. Since my last post the market has traded sideways allowing the moving averages to catch up so the stage is set for a potentially massive sell off. One possibility based on Fibonacci's is an 80% correction. Ouch!! Below is a chart with the Fibonacci drawn on it from the 2007 high to the 2009 bottom. You can see the market hit the 161.8 on the button.
 Thanks and Good Trading,
Tim
Thanks and Good Trading,
Tim
Saturday, January 10, 2015
The Next Big Stock Market Crash
Hey Folks,
Once again it has been awhile since my last post. Happy New Year to everyone. I'm not going to make any promises about more frequent posts this time.
The markets have had quite a run since the '09 lows but all good things must come to an end. I believe we are at the beginning of a significant market sell off. What will the catalyst be? Maybe a student loan crisis, rising rates, collapse of the dollar, terrorism or political unrest. I have no idea. All of my opinions are based on technical analysis not news or events.
I believe that SPY(SP500 ETF)will be cut in more then half over the next 1 - 2.5 years or so. My target is 85 and it's currently trading at 204.
So what do you do? If your portfolio is with a broker, typically you can only have 10% of your portfolio short. You could buy SDS which is a
n inverse ETF for SP500. So as the SP500 goes lower SDS goes higher. If you have a portfolio of stocks, you could use options to "collar" the position off. Here is how that works. Let's say you own 1000 shares of CBS at $55. You would sell 10 Jan 2017 65 calls at $4 giving you $4000 to buy 30 Jan 2017 35 puts at $1.30. Then if CBS falls to $25 over the next 2 years, you break even plus you keep the dividend. If you didn't hedge your position you would be down $30,000.
I may be a little early since the longer term moving averages are still trending up and have not started to flatten or roll over yet but i feel the top is already in. With this pattern we should move lower towards the October lows then run back up and then the big sell off begins. So time frame wise maybe March.
Thanks and Good Trading,
Tim
Subscribe to:
Comments (Atom)

