
Hi Folks,
I normally stick to technical analysis because that is what I know best. However, with my recent posts regarding the impending massive selloff, I figured I would impose my fundamental "opinion" here as well.
In some of my posts I questioned what the catalyst for the selloff would be? Terrorism, interest rates, student loan crisis etc. However any of these are just a guess to what tips the market on it's side. The root problem is the same as it was in 2007 only now much...much bigger.
Debt is what caused the massive selloff from 2007 to 2009. One would think that after that crisis, globally we would have learned a thing or two and made some changes. The sad fact is that in the last 7 years, global debt has increased by an incredible and unsustainable 40%. Our own federal reserve has increased the debt on it's balance sheet 800% since the market bottom in 2009. These levels are clearly unsustainable and ultimately this nation and other nations will have to make some hard choices to get back on track.
Couple the massive debt collapse with the shift from the "open outcry" trading model to a world where almost every market is 99% electronic trading and you set the stage for an 80% market correction.
This is what will be talked about in the media after the dust settles and the crisis is near it's end. Why isn't this a major focus for the media right now? Hopefully you are all taking steps to protect yourself from what is about to unfold.
Thanks and Good Trading,
Tim
Saturday, August 22, 2015


Friday, August 21, 2015
Market Crash Redux
Hi Folks,
Well it looks like the beginning stages of the selloff that I have been talking about is here. I think SPY will drop to 190 within the next 2 weeks. If that level doesn't hold the next level is 175. 190 would be a 10% drop off the highs but in my opinion just the beginning of the bigger selloff. Again, I have many scenarios that may unfold. The best case is a 30% selloff and the worst case is an 80% selloff. Any way you slice it, it's not good. Hopefully you took my advice and talked to your financial advisor about collaring off your positions. The market doesn't normally just go straight down so if you have not taken action you will get a chance to do so. The bottom will probably take 2 years to unfold.
Thanks and Good Trading,
Tim
Well it looks like the beginning stages of the selloff that I have been talking about is here. I think SPY will drop to 190 within the next 2 weeks. If that level doesn't hold the next level is 175. 190 would be a 10% drop off the highs but in my opinion just the beginning of the bigger selloff. Again, I have many scenarios that may unfold. The best case is a 30% selloff and the worst case is an 80% selloff. Any way you slice it, it's not good. Hopefully you took my advice and talked to your financial advisor about collaring off your positions. The market doesn't normally just go straight down so if you have not taken action you will get a chance to do so. The bottom will probably take 2 years to unfold.
Thanks and Good Trading,
Tim
Tuesday, August 11, 2015
Market Crash Imminent?
Hi Folks,
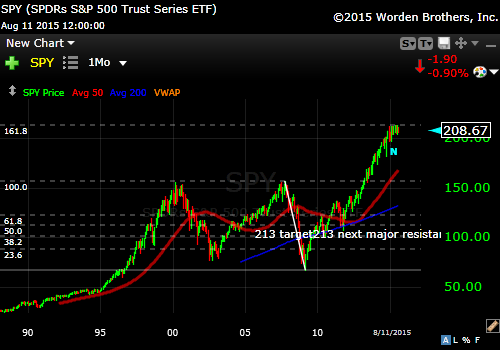
Just another update. I am still bearish on the market. I believe the selloff begins before the end of the year. Chart wise, the end of September looks particularly bad. It looks as though something bad is going to happen. Maybe terrorism? I really think people need to protect their portfolios going into the next few years. Since my last post the market has traded sideways allowing the moving averages to catch up so the stage is set for a potentially massive sell off. One possibility based on Fibonacci's is an 80% correction. Ouch!! Below is a chart with the Fibonacci drawn on it from the 2007 high to the 2009 bottom. You can see the market hit the 161.8 on the button.
 Thanks and Good Trading,
Tim
Thanks and Good Trading,
Tim
Saturday, January 10, 2015
The Next Big Stock Market Crash
Hey Folks,
Once again it has been awhile since my last post. Happy New Year to everyone. I'm not going to make any promises about more frequent posts this time.
The markets have had quite a run since the '09 lows but all good things must come to an end. I believe we are at the beginning of a significant market sell off. What will the catalyst be? Maybe a student loan crisis, rising rates, collapse of the dollar, terrorism or political unrest. I have no idea. All of my opinions are based on technical analysis not news or events.
I believe that SPY(SP500 ETF)will be cut in more then half over the next 1 - 2.5 years or so. My target is 85 and it's currently trading at 204.
So what do you do? If your portfolio is with a broker, typically you can only have 10% of your portfolio short. You could buy SDS which is a
n inverse ETF for SP500. So as the SP500 goes lower SDS goes higher. If you have a portfolio of stocks, you could use options to "collar" the position off. Here is how that works. Let's say you own 1000 shares of CBS at $55. You would sell 10 Jan 2017 65 calls at $4 giving you $4000 to buy 30 Jan 2017 35 puts at $1.30. Then if CBS falls to $25 over the next 2 years, you break even plus you keep the dividend. If you didn't hedge your position you would be down $30,000.
I may be a little early since the longer term moving averages are still trending up and have not started to flatten or roll over yet but i feel the top is already in. With this pattern we should move lower towards the October lows then run back up and then the big sell off begins. So time frame wise maybe March.
Thanks and Good Trading,
Tim
Once again it has been awhile since my last post. Happy New Year to everyone. I'm not going to make any promises about more frequent posts this time.
The markets have had quite a run since the '09 lows but all good things must come to an end. I believe we are at the beginning of a significant market sell off. What will the catalyst be? Maybe a student loan crisis, rising rates, collapse of the dollar, terrorism or political unrest. I have no idea. All of my opinions are based on technical analysis not news or events.
I believe that SPY(SP500 ETF)will be cut in more then half over the next 1 - 2.5 years or so. My target is 85 and it's currently trading at 204.
So what do you do? If your portfolio is with a broker, typically you can only have 10% of your portfolio short. You could buy SDS which is a
n inverse ETF for SP500. So as the SP500 goes lower SDS goes higher. If you have a portfolio of stocks, you could use options to "collar" the position off. Here is how that works. Let's say you own 1000 shares of CBS at $55. You would sell 10 Jan 2017 65 calls at $4 giving you $4000 to buy 30 Jan 2017 35 puts at $1.30. Then if CBS falls to $25 over the next 2 years, you break even plus you keep the dividend. If you didn't hedge your position you would be down $30,000.
I may be a little early since the longer term moving averages are still trending up and have not started to flatten or roll over yet but i feel the top is already in. With this pattern we should move lower towards the October lows then run back up and then the big sell off begins. So time frame wise maybe March.
Thanks and Good Trading,
Tim
Tuesday, March 11, 2014
Long WLT
Hi Folks,
I sold NAVB for about a 10% win today and bought WLT.
Thanks and Good Trading,
Tim
Thursday, January 23, 2014
Tuesday, January 21, 2014
NIHD
Hi Folks,
I sold out of the NIHD position today at $3.24 for a 27% gain in 2 weeks. Target is really $3.64 but a 27% in 2 weeks I don't want to get greedy. I'll keep you posted on the next trade.
Thanks and Good Trading,
Tim
I sold out of the NIHD position today at $3.24 for a 27% gain in 2 weeks. Target is really $3.64 but a 27% in 2 weeks I don't want to get greedy. I'll keep you posted on the next trade.
Thanks and Good Trading,
Tim
Subscribe to:
Posts (Atom)

 Posts
Posts

